When do you do your best work?
If you’re the type that likes to wake up early in the morning, maybe you find that your energy and ability to focus are at their highest peak during those early hours.
Or maybe you’re a night owl – you find that you’re on fire at 1 A.M., hacking away on a project while everyone else sleeps.
Conversely, when’s your worst time of the day? Do you hit an “afternoon slump” right after lunch and feel like you need to slip into a temporary coma under your desk?
You can probably dredge up some basic answers to these questions from your memory. But what if you knew exactly when your energy level would hit its peak on an average day?
Armed with knowledge like that, you could start to make intelligent changes to your schedule. You could plan to work on your most difficult, intellectually demanding tasks when your energy was highest.
Depending on the level of control you have over your obligations, you could start to shift meetings, errands, and other busywork to other times of the day – thus ensuring that your “Biological Prime Time” never gets taken up by things you know you could do half-asleep.
If you’re a student, you could use this information to build a better class schedule for next semester.
Knowing the typical ebb and flow of your energy levels would clearly be a boon to your productivity – but how do you figure it out in a truly precise way?
Simple: You track your energy levels. You treat your body just like a statistician treats a population – you gather data, average it, and look at the outcome.
In last week’s 5 Lessons video on The Productivity Project, I described how author Chris Bailey did exactly this in order to discover his own Biological Prime Time. However, when people started asking me for instructions on exactly how to replicate his experiment myself, I couldn’t find a solution I liked.
I didn’t want to carry around a notebook in my pocket and write my energy levels down by hand. And I certainly didn’t want any kind of system that would make me do manual calculations on my data later.
I wanted a system that was:
- Easy and fast to use – no more than 10 seconds spent entering data each time
- Automated – it had to average my data and graph it on its own
- Free – honestly, I’d be willing to pay $0.99 for a system like this, but everything that came close was priced closer to $5. No dice.
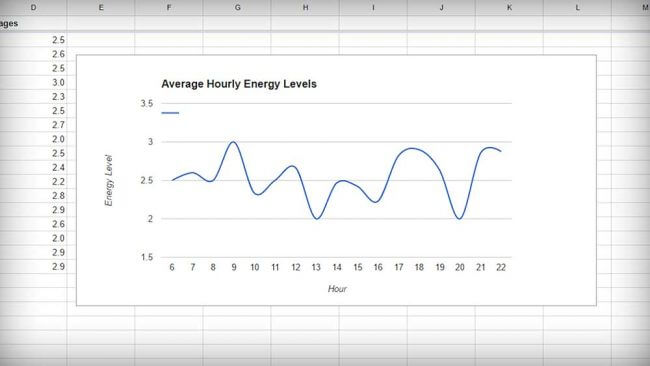
So I decided to build an energy tracking system myself. By inputting energy level data each hour over the course of several days, this system eventually yields a useful graph like this:
In this post, I’ll show you exactly how you can do the same; in fact, I’ve already taken care of the hardest part for you.
If you’d like to start tracking your own energy levels and discover your own Biological Prime Time, then follow along.
How to Build an Energy Tracking System
To make this experiment easy to run, our goal here is to set up a system that will let you easily let you enter data – your energy level at a given time – and then automatically process it. To achieve that, we’re going to combine three different tools: Google Forms, Google Sheets, and an hourly reminder app.
Here’s a quick glance at the steps we’ll take to set the system up. Since I’ve already done 90% of the work in setting up the Google Sheet, this shouldn’t take you more than 5-10 minutes to do.
- Make a copy of my Google Sheet, which will process your data
- Create a Google Form to track your energy levels
- Link your form to your spreadsheet
- Make a couple formula changes
- Add your form’s link to your smartphone’s home screen
- Set up an hourly reminder so you won’t forget to enter data
Let’s get started!
Step 1: Copy My Google Sheet
To get average hourly energy levels from the data you enter into your Google Form, we need to link that form up to a spreadsheet – which contains formulas to process the data.
Now you could build this spreadsheet yourself – but an easier solution would be to simply copy the one I’ve already built. So click here to go to my sample spreadsheet.
Next, hit File and click Make a Copy. Go ahead and name your copy whatever you want – “Energy Tracker” or “Mr. Taco McSparkles Visits the Moon God”. It doesn’t really matter.
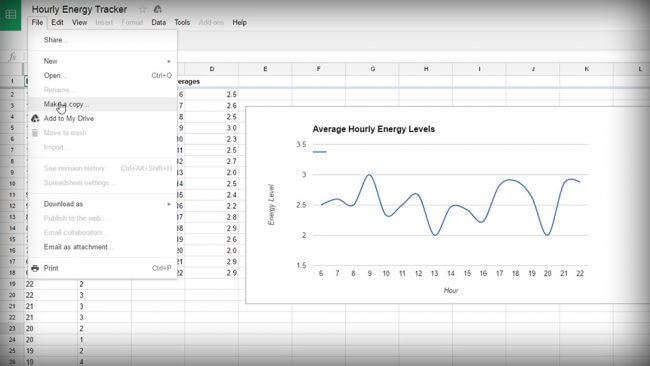
Now your copy of the spreadsheet should open in an new browser tab.
Important! Before you do anything, you need to change your copy of the spreadsheet’s timezone. Otherwise your timestamps are going to be all screwed up.
- Click File and then click Spreadsheet Settings.
- Change your time zone.
- Click Save Settings.
Now, if you look near the bottom-left of the screen, you’ll see that you’ve got two different sheets:
- Results (Sample)
- Responses (Sample)
In my original version of the Sheets project, Responses (Sample) is the sheet that recorded the responses from my Google Form. All the data there is bogus – I let a bunch of people from Twitter enter it in. But it demonstrates how the Sheet project works – to see how, click over the the Results (Sample) sheet.
Here, you’ll see that each cell in Column A records the hour from the timestamp in the corresponding cell over in Responses (Sample). Likewise, Column B records a numerical energy level value from its sister cell.
At this point, you might be asking:
“Why can’t we just set up other cells in Responses (Sample) to watch the cells that get data from the Form? Why do we need another sheet?”
That was the first way I tried to build this, and theoretically, it would work. However, when you link a Google Form to a Sheets project, the responses create entirely new rows. They don’t just fill in the next available row.
As a result, we can’t just do something easy like setting cell C1’s content to =HOUR(A1). The original A1 doesn’t ever get filled in – Google Forms creates a new A1.
What to do?
Luckily, we can use set up another sheet and use a command called ARRAYFORMULA to have it watch the original sheet and port over all its data.
If you look over at cells A2 and B2 of Responses (Sample), you’ll see how we’re using this command:
- A2’s content: =ARRAYFORMULA(VALUE(HOUR(‘Responses (Sample)’!A2:A)))
- B2’s content: =ARRAYFORMULA(VALUE(LEFT(‘Responses (Sample)’!B2:B,1)))
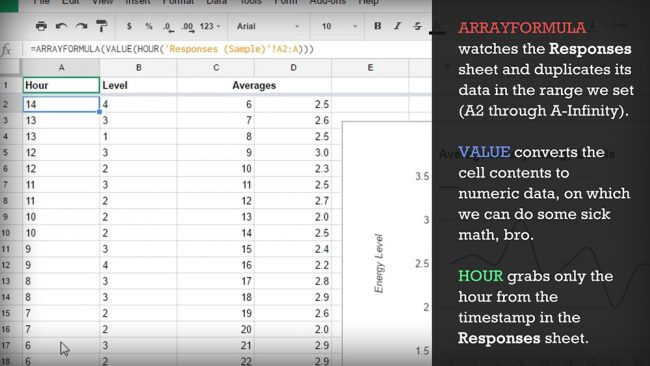
To run over it quickly, VALUE converts the cell content to a numerical data type (so we can do math on it), HOUR grabs only the hour from the timestamp, and LEFT grabs a specified number of characters from the cell it’s watching, starting from the beginning – you can see near the end of that formula that we only want 1.
See why copying the sheet’s a bit easier than making it yourself? 😉
Anyway, click the arrow next to Results (Sample) and then click Duplicate. Rename your duplicated sheet to Results.
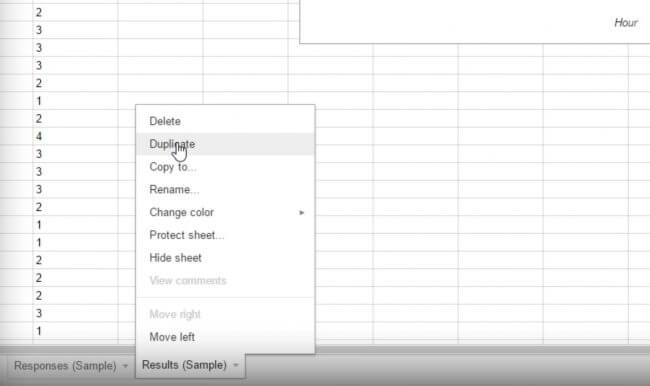
We’ll come back here in a moment, but first we need to whip up a Google Form.
Step 2: Create a Google Form
Setting up a Google Form will allow you to easily track your current energy level by answering one question. Since you have to track your energy several times a day, I wanted to make sure the process would be incredibly quick and easy.
Note: I’ll mention here that you don’t necessarily have to track your energy every single hour to get meaningful data. You could easily set up, say, five alarms at custom time throughout the day. However, my spreadsheet is set up to work best with hourly tracking (or at least tracking that’s done on the hour – it could be bi-hourly). So if you want to start changing the way you do things, I’ll leave the required formula changes as a challenge for you to figure out.
Head to Google Forms, click the Go to Google Forms button on the page, and then create a blank form. From there, build your form like so:
- Give the form a name, such as “Energy Tracker”
- Add a question to the form: “What’s your current energy level?”
- Add responses to the question. Enter as many as you want – I chose to go with a 1-4 scale for rating my energy levels.
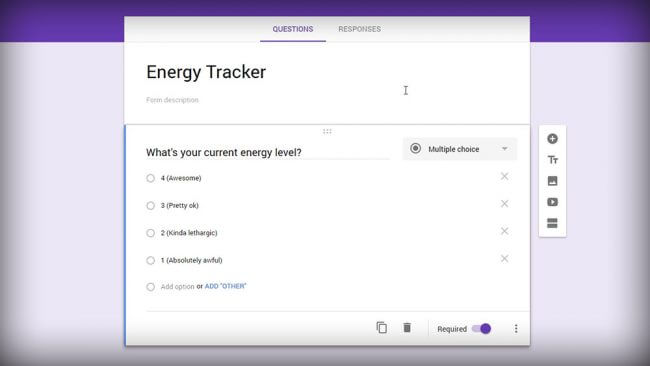
Important! The first character of each answer must be a number.
Remember that formula for cell B2 in our Results sheet? The LEFT command grabs the first character, and another cell uses that to get a numerical average. So your responses must start with numbers, or the whole thing won’t work.
- Next, set the question to Required
- Click the Responses tab and then click the green Sheets icon:
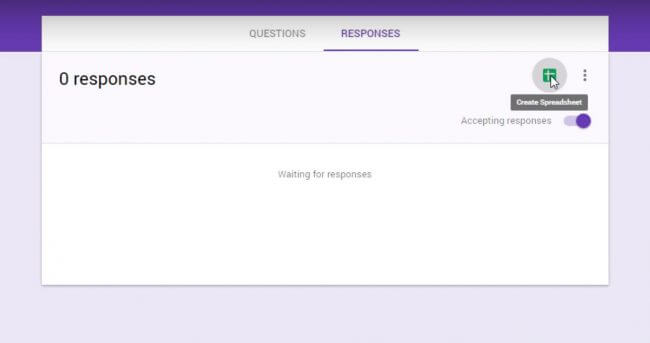
- Select an existing spreadsheet
- Choose your copy of my energy tracking spreadsheet
- Click Select
At this point, your spreadsheet should open back up again. Time to make a couple of small modifications to it.
Step 3: Edit the Spreadsheet
Looking at your Sheets project, you’ll notice that there’s a new sheet listed along the bottom with the others. It’ll probably be named Form Responses or something similar. Click the arrow next to its name, and rename it to Responses.
Now, head back over to your results sheet. Edit cells A2 and B2 so that they reference this new Responses sheet, rather than Responses (Sample). Here’s what you should get:
- A2’s content: =ARRAYFORMULA(VALUE(HOUR(‘Responses‘!A2:A)))
- B2’s content: =ARRAYFORMULA(VALUE(LEFT(‘Responses‘!B2:B,1)))
Luckily, that’s the only change you need to make! You’ll notice that the cells reference a range of cells – A2:A and B2:B.
In Excel and Google Sheets, defining a range like that (not putting a number on the second part) means the range is indefinite. It’ll keep watching from A2 and B2 down to infinity, so you can enter as many results as you like.
Step 4: Add the Form to your Phone’s Home Screen
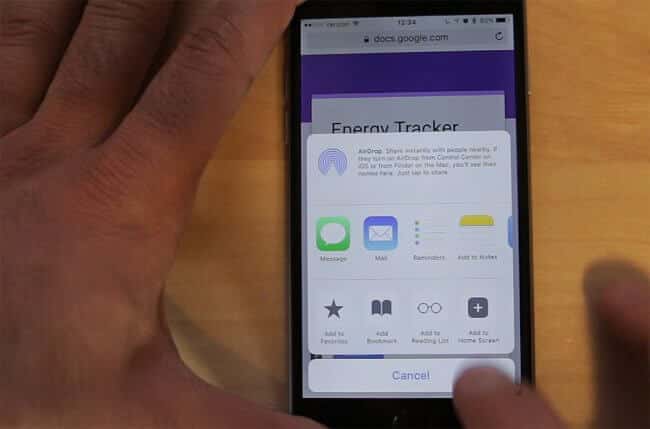
We’re on the home stretch – all that remains to be done now is to set up your phone so that it’s easy to enter data each hour.
Head back to where you were editing your Google Form, and click Send up in the top right corner. Choose the link tab, and then find a way to open that link on your smartphone. You could:
- Email it to yourself
- Choose the Short Link option and simply type it into your phone’s browser
- Use a syncing app like PushBullet
In any case, you just want to get it open on your phone’s browser. Now, add the form to your phone’s home screen so you can open it instantly when you need to. Here’s a HowToGeek article that will show you how to do that on any smartphone or tablet.
Step 5: Set Up Hourly Reminders
If you’re going to try to track your energy every hour, it’d probably be a good idea to set up a reminder system – I know I’d forget to do it without one.
As an iPhone user, I was a bit appalled to discover that there is no app in existence that hit all the criteria I wanted:
- Hourly notifications – ones that require an acknowledgment
- Customizable time window – so it’s not bugging you at night
- $0 cost – keeping with that free theme here
In fact, the only app I could find that would do the first two cost a whopping $5 – a bit too steep for this experiment.
As a result, I decided to go with the following apps as my recommendations here:
- iPhone: EveryHour – Makes your phone play a sound or vibrate every hour. Just sounds – no notifications. But it does have a customizable time window.
- Android: Blip Blip – Seems quite similar to EveryHour, possibly even more full-featured.
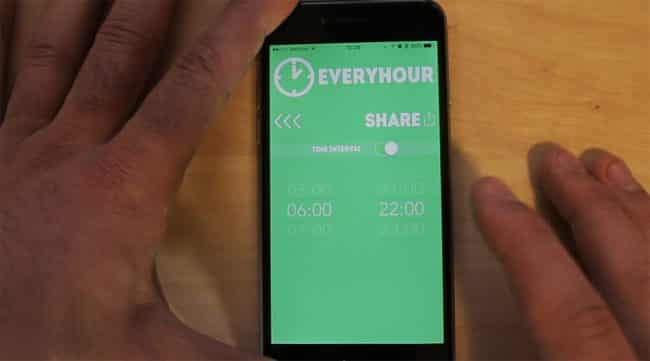
As far as I’m concerned, this isn’t the most ideal solution – I really would have liked a system that actually forced me to take action on a notification. Or, even better, one that sent me a text message with the link to my form every hour.
Now, there are methods of achieving this for free. One option I explored was using IFTTT – I created a recipe that used the Date and Time channel as a trigger and the SMS channel as the action.
However, the Date and Time channel’s “hourly” trigger unfortunately won’t let you set up a custom time window. It just triggers every single hour. The only way around this would be to use the “Every day at X” hour trigger instead, and to create a separate recipe for every hour.
I wanted the setup for this system to be somewhat elegant, so I decided to avoid doing that. Technically, you could do the exact same thing with your phone’s default alarm app.
Me? I’m ok just training myself to respond to EveryHour’s beep.
Now, Gather Some Data!
Once you’ve got your system set up, all that’s left to do is gather the data. Over the next 1-2 weeks, keep your system running and diligently enter your energy level each hour during the time window you want to track.
Along the way, you can keep an eye on how your graph changes. After you’ve entered a suitable amount of data, your graph should accurately reflect how your energy levels tend to shift over the course of the day.
After you’ve done that, you’ll have a good grasp on when your Biological Prime Time is. Use that knowledge to start tweaking your schedule.
Here’s to greater productivity!


